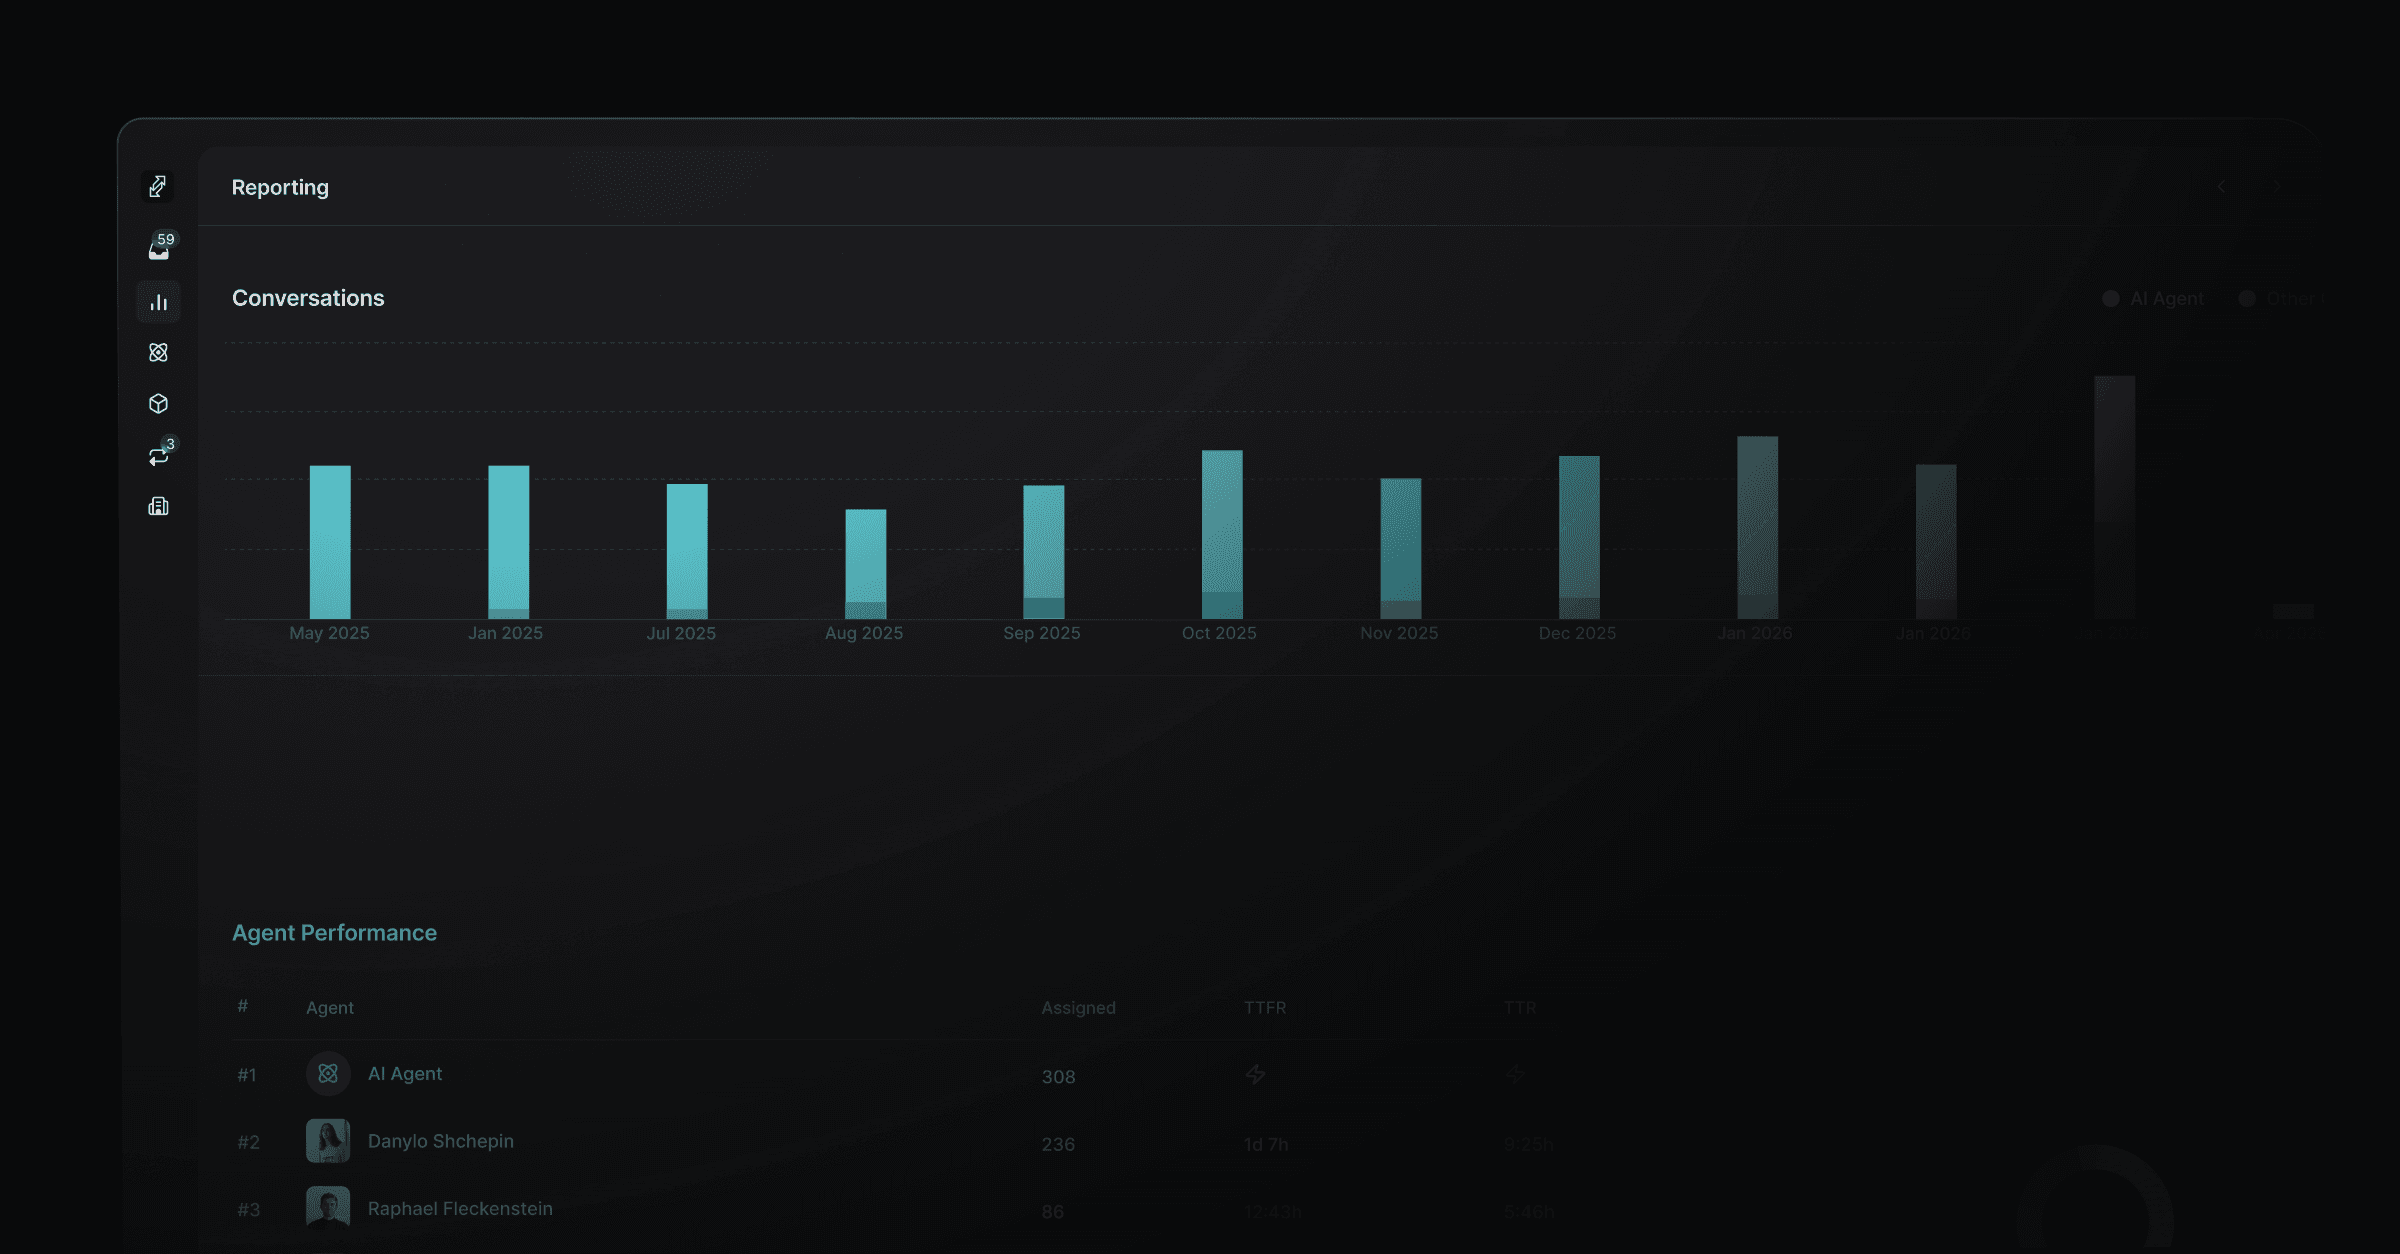
Reporting shows how your support runs: how many conversations come in, how fast your team answers, how much the Productlane Agent resolves, and which requests matter most. Open it from the main navigation, or press G then R.
Every number follows the date range picker at the top, which defaults to the last four weeks.
The main numbers side by side: new and closed conversations, the AI resolution rate, the SLA miss rate, median first response and resolution times, and queue depth.
It also charts new conversations per day and the time from report to implementation: the median hours between a conversation arriving and its first linked Linear issue completing. Longer ranges group the trend by week or month.
Below the charts are the busiest tags, tiers, and companies, and a table of your team with each person's assigned threads and reply times. The Productlane Agent has its own row.
Volume in detail: new conversations per day, new conversations by channel, the hourly spread of new conversations, and the pipeline of threads across Todo, Snoozed, and Done.
The AI resolution rate chart plots conversations the AI resolved against all conversations. It also counts a closed, unassigned conversation the agent took part in, so the rate can run above the resolutions you are billed for. See AI Usage & Credits for what counts as a billed resolution.
Each teammate's share of assigned threads.
First response times as average, median, and p90, how they trend over time, and the hours when your team replies. It also covers time to assign, reassigns, replies needed to close, and the share of threads closed on first contact.
Customer requests on your Linear projects and issues over time, so you can tell a request that comes up every week from one that spiked recently. A third view shows your tags by group, each with its volume over time.
Requests created outside Productlane count too. Press Cmd/Ctrl + K and run Sync Linear to bring them in.
The Filter button next to the range picker filters by Assignee, Origin, Tag, and Company. Pick as many values as you like, and the active ones show as chips under the header.
A filter applies to every tab. Averages, medians, p90, and trend lines all recalculate on the filtered set.
To compare one client against the rest, open Responsiveness, filter Company to that client, and read their response times. Clear the filter and the same numbers become the baseline across all clients.
Readers can rate a docs article with a thumbs up or down. The rating shows on the article itself. Reporting has no view of article traffic, docs searches, or ratings across articles.